Multi-Class Text Classification
This post and code are used in a challenge organized by LOCUS called DataRush.
Hi! Today in this post I am going to share our effort which was applied by us in a competition organized by LOCUS.
Lets start. For this challenge we were given a dataset which contains a train CSV with four columns and 390,603 rows: 390603 rows × 4 columns. In each row we have:
- id — a random identifier for each entry
- abstract — the main field for classification (the opening paragraph of a research paper, giving its character and overview)
- category — the category we have to classify the abstract into
- category_num — the numeric code for the respective category
df_train
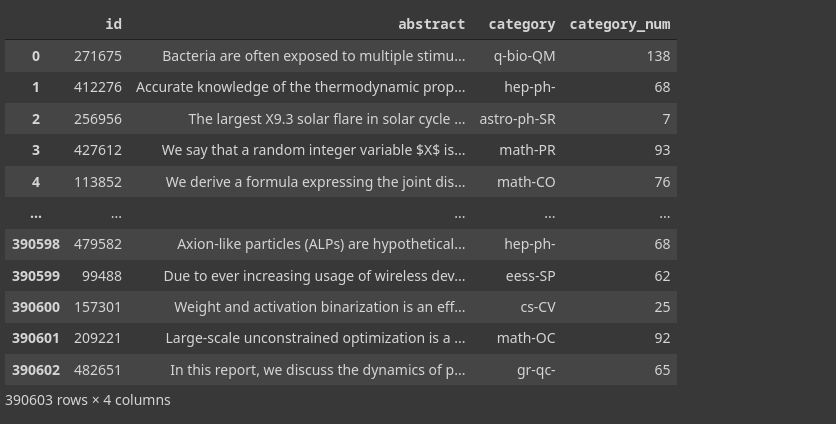
    id 	abstract 	category 	category_num
0 	271675 	Bacteria are often exposed to multiple stimu... 	q-bio-QM 	138
1 	412276 	Accurate knowledge of the thermodynamic prop... 	hep-ph- 	68
2 	256956 	The largest X9.3 solar flare in solar cycle ... 	astro-ph-SR 	7
3 	427612 	We say that a random integer variable $X$ is... 	math-PR 	93
4 	113852 	We derive a formula expressing the joint dis... 	math-CO 	76
... 	... 	... 	... 	...
390598 	479582 	Axion-like particles (ALPs) are hypothetical... 	hep-ph- 	68
390599 	99488 	Due to ever increasing usage of wireless dev... 	eess-SP 	62
390600 	157301 	Weight and activation binarization is an eff... 	cs-CV 	25
390601 	209221 	Large-scale unconstrained optimization is a ... 	math-OC 	92
390602 	482651 	In this report, we discuss the dynamics of p... 	gr-qc- 	65

390603 rows × 4 columns
Data Visualization
From EDA we found that this dataset is severely imbalanced. Some categories have only one sample while others have thousands. This adds significant complexity to classification.
Category distribution in the training data:
plt.figure(figsize=(25,4))
df_train['category'].value_counts().plot(kind='bar')
plt.axis()
plt.show()
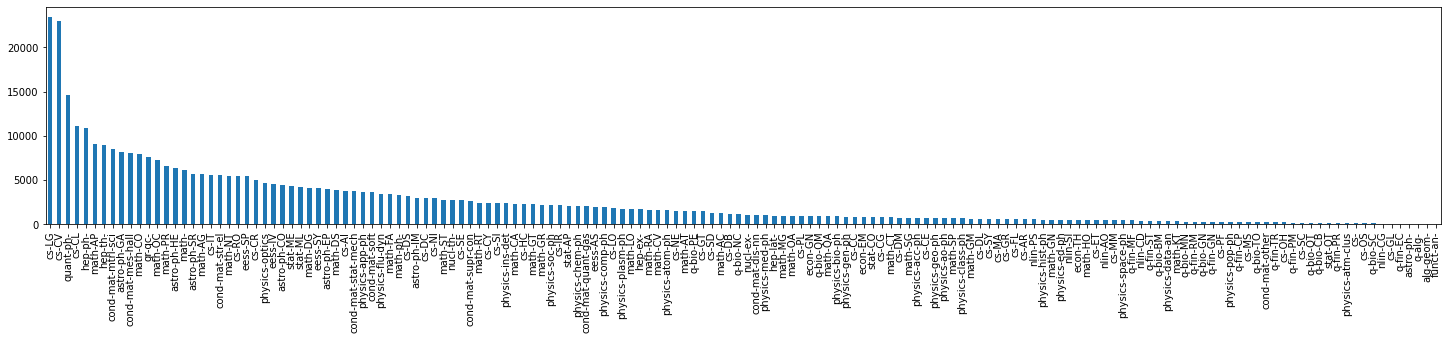
A similar imbalance exists in the test data:

Since the chart makes it hard to see the differences, we manually plotted the count for each class and were shocked by the results — two categories had only a single sample each.
catetr = df_train['category'].value_counts()
catetr
cs-LG        23414
cs-CV        22943
quant-ph-    14561
cs-CL        11143
hep-ph-      10863
             ...
q-fin-EC        17
astro-ph-        7
q-alg-           2
alg-geom-        1
funct-an-        1
Name: category, Length: 156, dtype: int64
Data Processing
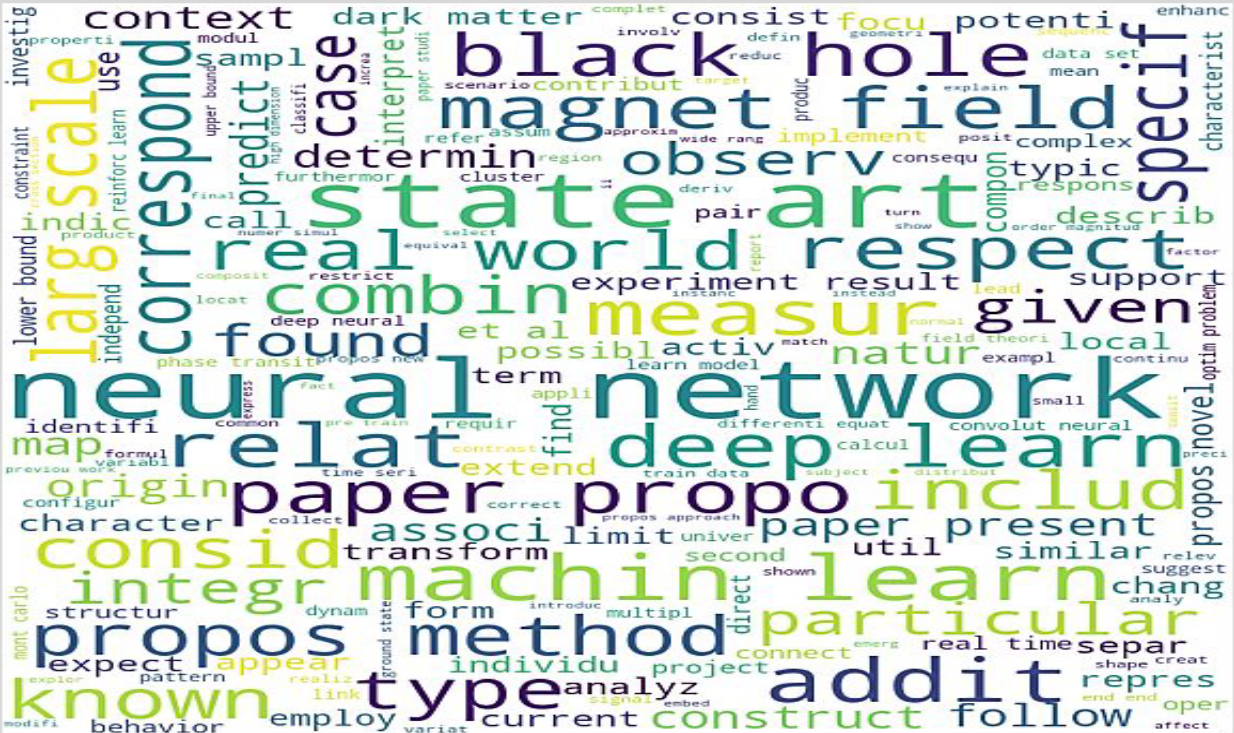
We applied stemming to shorten words by removing suffixes — Porter Stemmer from NLTK. We chose stemming over lemmatization because it reduces word size while preserving the core meaning. In addition, we removed regular-expression noise, punctuation, stop words, and normalised all text to lowercase. The same pipeline was applied to train, validation, and test sets.
# for stemmer
ps = PorterStemmer()

# function for data cleaning: regex, punctuation, lowercasing, stop word removal
def clean_abstract(text):
    text = re.sub('[^a-z\s]', ' ', text.lower())
    text = [i.lower() for i in text.split() if i not in nlp.Defaults.stop_words]
    text = [ps.stem(i) for i in text]
    text = ' '.join(text)
    text.replace('\n', ' ')
    return text

# cleaning train data
df_train['abstract'] = df_train['abstract'].apply(clean_abstract)

# cleaning test data
df_test['abstract'] = df_test['abstract'].apply(clean_abstract)

# cleaning val data
df_val['abstract'] = df_val['abstract'].apply(clean_abstract)

X_train, y_train = df_train['abstract'], df_train['category']
X_val, y_val     = df_val['abstract'],   df_val['category']
X_test           = df_test['abstract']
Text Vectorization
TF-IDF
CountVectorizer
Model for Data Generation
Machine Learning
SVC
Logistic Regression
KNN
MultinomialNB
Data Balancing
Over Sampling
Under Sampling
Machine Learning
SVC
Logistic Regression
KNN
MultinomialNB
Ensemble
Other Models
NLTK
Neural Network
BERT
Multi-Layer Neural Network
CNN
LSTM
Confusion Matrix
Submission
Conclusion
Cite This Post
Auto-generated. Verify for your institution's requirements.