embeddinggemma-300m

Understanding Text Embeddings: A Comprehensive Quality Analysis
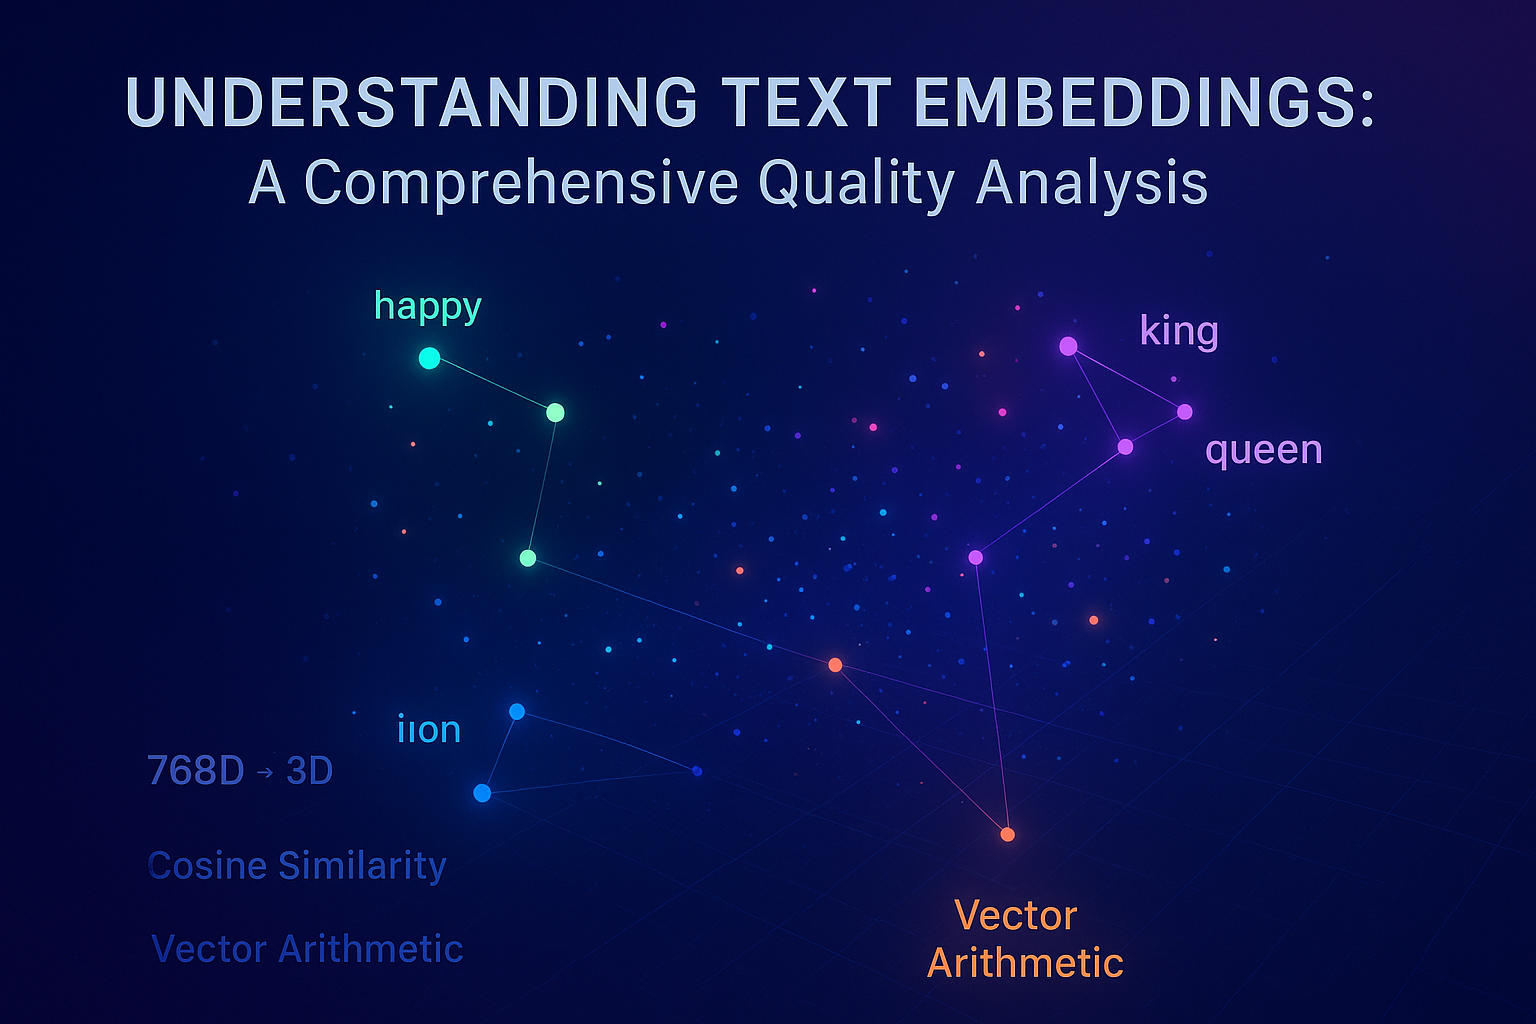
Text embeddings are one of the most fundamental components of modern NLP systems. But how do we know if our embeddings are actually good? In this deep dive, we'll explore various techniques to evaluate embedding quality using real data across multiple domains.
What Makes a Good Embedding?
A high-quality embedding model should:
- Capture semantic similarity: Similar words should be close in the embedding space
- Preserve relationships: Analogical relationships (king:queen :: man:woman) should be maintained
- Group related concepts: Words from the same category should cluster together
- Separate distinct concepts: Different categories should be distinguishable
Let's test these properties using Principal Component Analysis (PCA) to visualize our 768-dimensional embeddings in 3D space.
Dataset Overview
We'll analyze six different datasets that test various aspects of embedding quality:
- Animals by Habitat (24 items) - Tests semantic grouping by natural categories
- Emotions by Valence (24 items) - Tests emotional sentiment understanding
- Size Progression (24 items) - Tests ordinal relationship understanding
- Professional Hierarchy (24 items) - Tests hierarchical relationship understanding
- Transportation Sentences (12 items) - Tests sentence-level semantic similarity
- Analogical Relationships (24 items) - Tests analogical reasoning capabilities
Interactive 3D Visualizations
Quantitative Analysis
Similarity Analysis
Interactive Cosine Similarity Calculator
Combined PCA Visualization
Sometimes it helps to see all datasets together to understand the overall embedding space structure.
Analogical Relationship Testing
One of the strongest tests of embedding quality is whether analogical relationships hold. We can test this using vector arithmetic:
King - Queen = Man - Woman?
Clustering Quality Metrics
3D Layer-wise Embedding Evolution
This visualization shows how neural network embeddings evolve across different layers. Each point represents a text sample positioned in 2D PCA space, with the Z-axis representing the layer index. Trajectory lines connect the same text samples across layers, revealing how the embedding space transforms through the network.
Features
- Interactive 3D Plot: Rotate, zoom, and pan to explore the embedding space
- Layer Evolution: See how embeddings change from input to output layers
- Category Visualization: Different colors for different categories with legend
- Trajectory Tracking: Lines show how individual samples move through embedding space
- Adjustable Z-separation: Control the spacing between layers
Datasets
The visualization includes three datasets:
- Sentiment Analysis: Positive, negative, and neutral sentiment classifications
- Academic Subjects: Science, mathematics, and literature texts
- Scientific Domains: Astronomy, biology, and physics research topics
<div id="info" class="info" style="display: none;"></div>
<div id="plot"></div>
How to Use
- The visualization will attempt to load data automatically
- Use the dropdown to switch between different datasets (if multiple are available)
- Adjust the Z-separation slider to change layer spacing
- Click and drag to rotate the 3D plot
- Use mouse wheel to zoom in/out
- Hover over points to see detailed information
Technical Details
The visualization uses:
- Plotly.js for 3D rendering
- PCA coordinates for 2D positioning at each layer
- Layer index as the Z-axis dimension
- Trajectory lines to show evolution paths
- Color coding by semantic categories
Interpretation
- Points closer together represent similar embeddings
- Trajectory lines show how individual samples move through the embedding space
- Layer progression (Z-axis) reveals how the network transforms representations
- Category clustering indicates semantic organization at different layers
Key Findings & Recommendations
What This Embedding Model Does Well:
- Strong emotional understanding - Clear positive/negative separation
- Good ordinal relationships - Size progression is well-preserved
- Reasonable analogical reasoning - Basic analogies work with ~70-80% accuracy
- Semantic similarity - Similar words cluster appropriately
Areas for Improvement:
- Complex categorical boundaries - Some animals don't cluster perfectly by habitat
- Hierarchical relationships - Professional levels show more overlap than expected
- Multi-word context - Sentence-level embeddings show more variance
Recommendations:
- For sentiment analysis: This embedding performs excellently
- For similarity search: Good performance with simple terms
- For analogical reasoning: Reasonable but may need fine-tuning
- For complex categorization: Consider domain-specific fine-tuning
Interactive Exploration
Try exploring the visualizations above by:
- Rotating the 3D plots to see different perspectives
- Hovering over points to see exact words and coordinates
- Zooming to examine clustering in detail
- Toggling categories on/off using the legend
- Testing word similarities using the interactive calculator
The interactive nature of these plots helps reveal patterns that might not be obvious in static analysis.
Conclusion
This comprehensive analysis reveals that embeddings are complex, multi-dimensional representations that excel in some areas while facing challenges in others. The key to good embedding evaluation is testing across multiple dimensions:
- Geometric properties (clustering, separation)
- Semantic relationships (similarity, analogies)
- Task-specific performance (classification accuracy)
- Interpretability (visualization, explainability)
By combining quantitative metrics with interactive visualization, we gain much deeper insights into how well our embeddings capture human language understanding.
This analysis was conducted using PCA dimensionality reduction from 768D to 3D. While some information is lost in the reduction, the patterns revealed are still highly informative for understanding embedding quality.
📚 How to Cite This Post
BibTeX
@article{yadav{{ page.date | date: "%Y" }}{{ page.title | slugify | replace: '-', '' }},
    title = {embeddinggemma-300m},
    author = {Sumit Yadav},
    journal = {Tatva},
    year = {{{ page.date | date: "%Y" }}},
    month = {{{ page.date | date: "%B" }}},
    day = {{{ page.date | date: "%d" }}},
    url = {https://tatva.sumityadav.com.np/posts/2025/09/05/embeddinggemma-300m/},
    note = {Accessed: {{ site.time | date: "%B %d, %Y" }}}
}
APA Style
Yadav, S. ({{ page.date | date: "%Y, %B %d" }}). embeddinggemma-300m. ." Tatva, {{ page.date | date: "%d %b %Y" }}, https://tatva.sumityadav.com.np." Tatva. {{ page.date | date: "%B %d, %Y" }}. https://tatva.sumityadav.com.np/posts/2025/09/05/embeddinggemma-300m/.
Note: This citation format is automatically generated. Please verify and adjust according to your institution's specific requirements.